The Day My "Index Optimization" Melted Our Database 🔥
How removing a seemingly broken SQL condition made our CPU spike to 100% and the InnoDB architecture lesson hiding underneath.

Table of Contents
It was a regular Monday morning. I was sipping my chai ☕, scanning through our monitoring dashboards, when I noticed something that had been bugging me for weeks - a SQL condition that was obviously wrong.
Many queries in our multi-tenant SaaS application had this filter:
WHERE (tenant_id = 42 OR tenant_id IS NULL)
  AND org_id = 100
  AND is_active = 1
  AND is_deleted = 0
That “OR tenant_id IS NULL” was sitting in every single query for a lot of tables. And I knew from years of database experience that OR conditions are index killers. Every DBA will tell you:
“An OR with IS NULL prevents MySQL from using indexes efficiently.”
So I did what any reasonable engineer would do. I removed it.
I pushed the fix. Deployed it. And then watched our RDS CPU climb from a comfortable 60% to a screaming 100% 📈💀.
I had just optimized our database into a meltdown 🔥.

🏗️ The Setup: A Multi-Tenant Nightmare
Let me give you some context. We run a B2B SaaS platform - think of it like a simplified ERP system. Every customer (tenant) has their own data, but it all lives in the same database. The data model looks something like this:
CREATE TABLE orders (
    id BIGINT PRIMARY KEY AUTO_INCREMENT,
    tenant_id INT,
    org_id INT,
    order_date DATE,
    amount DECIMAL(10,2),
    is_active TINYINT(1) DEFAULT 1,
    is_deleted TINYINT(1) DEFAULT 0,
    -- ... 30 more columns
    INDEX (tenant_id),
    INDEX (org_id),
    INDEX (is_active)
);
The orders table had ~200,000 rows. Not huge, but not trivial either. And here’s the kicker, for any given tenant, a query would typically return about 50,000 rows out of those 200,000. That’s a 25% selectivity ratio. Remember this number. It’s going to matter a lot.
Now, some tables in our system had “shared” or “global” records, things like default payment terms, standard tax rates, common bank entries. These records had tenant_id = NULL because they belonged to everyone. But somewhere along the way, a developer had added the OR tenant_id IS NULL condition to every model’s query, not just the ones with shared records.
It was sloppy. It was clearly wrong. And it was my job to clean it up.
💥 The “Fix” That Broke Everything
The change was surgical. I went through the codebase and updated the query builder:
Before (every model):
WHERE (tenant_id = 42 OR tenant_id IS NULL)
  AND org_id = 100
  AND is_active = 1
  AND is_deleted = 0
After (transactional models only):
WHERE tenant_id = 42
  AND org_id = 100
  AND is_active = 1
  AND is_deleted = 0
Clean. Precise. The kind of change that should make indexes happy.
I deployed it on a Tuesday morning. By Tuesday afternoon, our Slack was on fire 🔥.
“The dashboard is crawling.”
“API timeouts across the board.”
“RDS CPU is pegged at 100%.”
I checked New Relic. Query times were actually slightly faster . 1-3 seconds vs the previous 2-5 seconds. But CPU had gone through the roof. How could faster queries use more CPU?
I reverted the change. CPU dropped back to ~60%. Queries went back to being slow but stable.
I sat there staring at my screen, feeling like I’d just witnessed a violation of the laws of physics 🤯.
🕳️ Down the Rabbit Hole: InnoDB’s Dirty Secret
Here’s where things get interesting. To understand what happened, you need to understand something most developers never think about: how InnoDB actually stores your data.
InnoDB doesn’t just dump rows into a file. It maintains two separate data structures for every table:
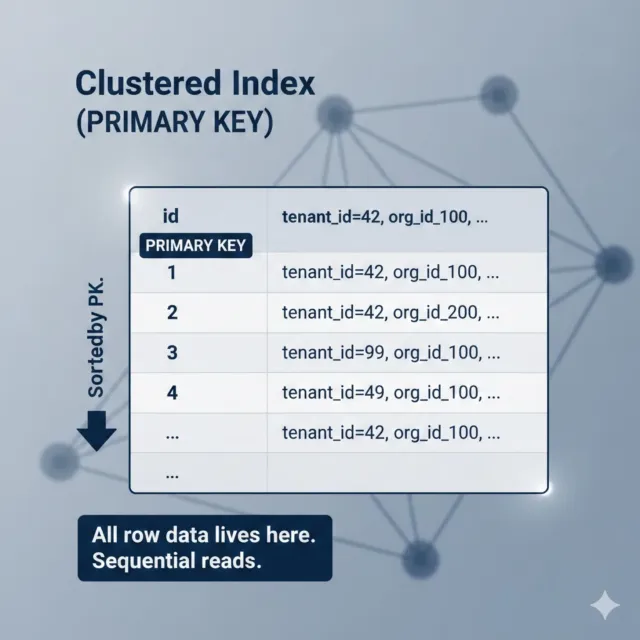
Structure 1: The Clustered Index (a.k.a. “The Actual Table”)
In InnoDB, the primary key isn’t just an index - it is the table. Rows are physically stored sorted by the primary key. When you do a full table scan, you’re reading this structure sequentially, cover to cover, like reading a book.
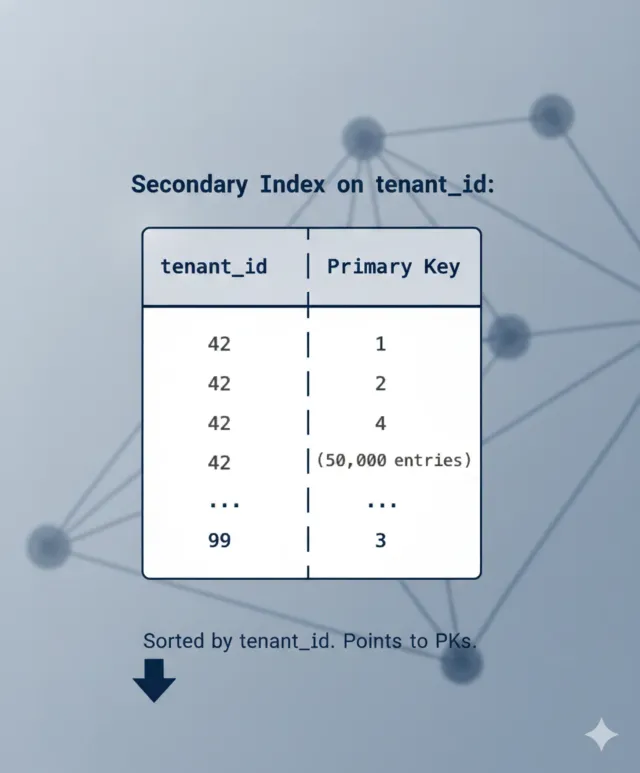
Structure 2: Secondary Indexes (Your Regular Indexes)
Every other index like INDEX(tenant_id), INDEX(org_id) is a secondary index. And here’s the crucial part: secondary indexes don’t contain the full row data. They only contain:
-
The indexed column(s)
-
A pointer back to the primary key
That’s it. No org_id, is_active or amount. Just the indexed column and a PK reference.
This design choice has a profound consequence.
💸 The Two-Lookup Tax
When MySQL uses a secondary index to find rows, it has to do two lookups for every single match:
-
Look up the secondary index → finds matching PKs
-
Look up the clustered index → retrieves the actual row data using each PK
This second step is called a “bookmark lookup” or “clustered index lookup.” And it’s not a sequential read- it’s a random seek. The primary keys from the secondary index are scattered across the clustered index. So for each match, InnoDB has to jump to a completely different location on disk.
Let me paint this picture clearly.
What Happened BEFORE My Change (Full Table Scan)
With “OR tenant_id IS NULL” in the query, MySQL’s optimizer looked at the query and thought: “This OR condition makes the index useless. I’ll just scan the whole table.”
Full Table Scan:
Read row 1 → check conditions → keep/discard
Read row 2 → check conditions → keep/discard
Read row 3 → check conditions → keep/discard
... (200,000 rows, read sequentially)
I/O Pattern: Sequential(Like reading a book from start to finish)
CPU cost: LOW (just comparing values)
Disk cost: HIGH but efficient (sequential reads)
Wall time: 2-5 seconds
Sequential I/O is remarkably efficient. The disk head moves in one direction, reading contiguous blocks. The CPU barely breaks a sweat it’s just checking if (tenant_id == 42) for each row. Most of the time, the CPU is waiting for the disk to deliver the next chunk.
This is an I/O-bound operation. The bottleneck is disk speed, not CPU.
What Happened AFTER My Change (Index Scan)
Without the OR condition, MySQL suddenly had a usable index on tenant_id. So the optimizer switched strategies: “Great, I can use the tenant_id index! Let me find all rows where tenant_id = 42.”
Index Scan + Clustered Index Lookups:
Step 1: Scan tenant_id index → find 50,000 matching PKs
Step 2: For EACH of those 50,000 PKs:
→ Random jump to clustered index
→ Read full row
→ Check: org_id = 100? is_active = 1? is_deleted = 0?
→ Keep or discard
I/O Pattern: Random (Like flipping to 50,000 random pages in a book)
CPU cost: HIGH (coordinating 50,000 random seeks)
Disk cost: 50,000 individual random reads
Wall time: 1-3 seconds
Each of those 50,000 random seeks requires the CPU to:
-
Navigate the B-tree index structure
-
Calculate the physical disk location
-
Issue the I/O request
-
Handle the I/O completion interrupt
-
Manage the InnoDB buffer pool
This is a CPU-bound operation. The CPU is constantly busy coordinating random I/O.
🧮 The Counter-Intuitive Math
Here’s where it clicks. Let me lay out the numbers:
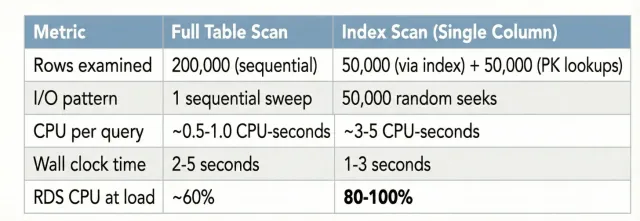
The index scan was faster in wall-clock time therefore the query returned results quicker. But it consumed 5x more CPU doing it. Under concurrent load (dozens of these queries running simultaneously), the CPU saturated, everything started queuing, and the whole system ground to a halt.
🎯 The Selectivity Problem
This leads to one of the most important rules in database performance that many engineers miss:
Selectivity = (Rows returned) / (Total rows in table)

-
< 5% selectivity: Index scans are clearly better. Few lookups = low overhead.
-
5-15% selectivity: Grey zone. Depends on hardware, data distribution, index type.
-
> 15% selectivity: Full table scans often beat single-column index scans.
Our queries had 25% selectivity. We were firmly in “table scan wins” territory for single-column indexes. MySQL’s optimizer actually knew this and that’s why it chose table scans when the OR condition was present. We accidentally forced it into an inferior plan by making the index “usable.”
✅ The Real Fix: Composite Indexes
So if single-column indexes are the problem, what’s the solution? You don’t go back to table scans, instead you use composite indexes.
A composite index includes multiple columns in a single index structure:
CREATE INDEX idx_orders_tenant_org_active_deleted
ON orders(tenant_id, org_id, is_active, is_deleted);
Here’s what this changes. Instead of a secondary index that only knows about tenant_id:
Single-column index:
Find tenant_id = 42 → 50,000 rows
Then: 50,000 random PK lookups to check other conditions
The composite index knows about all four filter columns:
Composite index on (tenant_id, org_id, is_active, is_deleted):
Navigate to tenant_id = 42
└─ Navigate to org_id = 100
└─ Navigate to is_active = 1
└─ Navigate to is_deleted = 0
└─ Only 1,000 rows match ALL conditions!
Then: Only 1,000 PK lookups (not 50,000!)
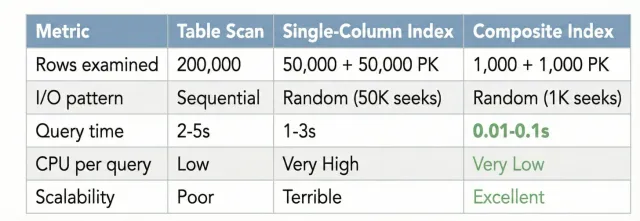
The filtering happens inside the index itself. By the time MySQL needs to do PK lookups to fetch full row data, it’s already narrowed down from 50,000 to 1,000 rows. That’s a 50x reduction in random I/O.
🐘 Wait, But Would This Happen in PostgreSQL?
This is where things get engine-specific. Everything I’ve described is a characteristic of InnoDB’s clustered index architecture. PostgreSQL handles things differently, and the same scenario would play out differently there.
InnoDB (MySQL): Clustered Index Architecture
-
The table is the primary key index (clustered)
-
Secondary indexes store PK pointers, not row data
-
Every secondary index lookup requires a second hop to the clustered index
-
This “double lookup” is the root cause of our CPU spike
PostgreSQL: Heap-Based Architecture
-
The table is stored as a heap where rows are stored in insertion order, not sorted by PK
-
All indexes (including the primary key) are secondary indexes
-
Indexes point to a physical row location (tuple ID / ctid) on the heap
-
There’s no “clustered index lookup” step because the index points directly to the row’s physical location
InnoDB :
Secondary Index → PK value → Clustered Index → Row Data
(Two B-tree traversals per row)
PostgreSQL:
Index → Physical Row Location (ctid) → Row Data
(One B-tree traversal + one heap fetch per row)
So in PostgreSQL, our 50,000 index matches would each require one hop to the heap, not two hops through the clustered index. The CPU overhead would be lower.
But PostgreSQL has its own trade-off. Since the heap isn’t sorted by any index, all index lookups involve random heap access. There’s no concept of a “clustered scan” where the index order matches the physical data order (unless you explicitly use CLUSTER, which is a one-time operation that doesn’t persist).
In InnoDB, if your query scans the primary key in order, you get beautiful sequential reads because the data is physically sorted by PK. In PostgreSQL, even a primary key scan can involve random heap access.
For a different PostgreSQL failure mode, see how we used AI to investigate a search query that bypassed its trigram index. That investigation connects Django's generated SQL, the index definition and the query plan, then checks the proposed fix against both timings and search results.
🧠 Key Takeaways
-
“OR kills indexes” is true but that might be saving you. If your single-column indexes would cause worse performance than a table scan, the OR condition is accidentally keeping you in the better execution plan.
-
Selectivity is everything. If your query returns more than 15% of a table’s rows, a single-column index scan can be worse than a full table scan due to random I/O overhead.
-
Understand your storage engine. InnoDB’s clustered index architecture means every secondary index lookup pays a “double-hop” tax. This tax is invisible when selectivity is low but devastating when selectivity is high.
-
Composite indexes are the real answer. They don’t just make queries faster, they fundamentally change the math by filtering inside the index before touching the main table.
-
Monitor CPU, not just query latency. A query that’s 2x faster but uses 5x more CPU is a net negative under concurrent load.
-
Know your engine’s differences. The same schema optimization can have very different effects on InnoDB vs PostgreSQL due to their fundamentally different storage architectures.
The next time someone tells you “just add an index,” ask them: “What kind of index, and what’s your query’s selectivity?” The answer might surprise you.